Even if you’ve never seen a copy of the USDA hardiness map, you’ve likely comes across its zones mentioned on the backs of seed packets, on plant tags, and in plant guides on website like ours. More seasoned gardeners can use the information to help decide if a plant will thrive or survive in their garden, or if they should take a chance on a plant outside of their zone.
This past November, the US Department of Agriculture issued its first map update in more than a decade. Here’s what it means for you.
What is the USDA hardiness map anyway?

The USDA hardiness map—the official name is Plant Hardiness Zone Map—helps gardeners determine which perennial plants can survive in their climate. It is based on the average annual minimum temperature in a given area (in other words, how low the temperature gets in your area on average).
The USDA created the hardiness map in 1960 and it has been updated in 1990 and 2012. The map is divided into 13 hardiness zones that represent 10 degree increments, and then further split into half zones with ‘a’ and ‘b’ sections that represent five degree increments. Zone 1 is the coldest zone, with an average annual minimum temperature of -60°F or below. Zone 13 is the warmest zone, with an average annual minimum temperature of 60°F or above.
What changed in the updated map?

- About half the US—mainly in the Midwest and Northeast—has moved into the next warmer half zone.
- Updated collected data over a longer period of time using 1991 to 2020 versus earlier maps.
- Increased granular information for locations and now includes microclimates of cities, mountain ranges, and near bodies of water. This is due to over a 50 percent increase in temperature data sources, with 13,625 weather stations for 2023 versus 7,983 in 2012.
- Includes a new “Tips for Growers’ section.
Gardeners need to keep in mind that the map uses a single data point. It is the average lowest temperature in a given location over the last 30 years. The key word here is average. If you’re in zone 7b, it means your lowest average winter temperature is 5°F to 10°F. It does not mean you won’t have one or more colder days that could kill certain plants.
It also doesn’t take into consideration variables specific to your garden. This includes your soil composition, the amount of sunlight, and any microclimates produced by structures. An example would be a fig tree that can be susceptible to winter dieback: In a sheltered area, up against a cinder block garage, it may do just fine due to the stored heat energy from the sun that the cinder blocks release at night, keeping the aerial part of the plant from freezing.
What are the real world applications of the updated map?

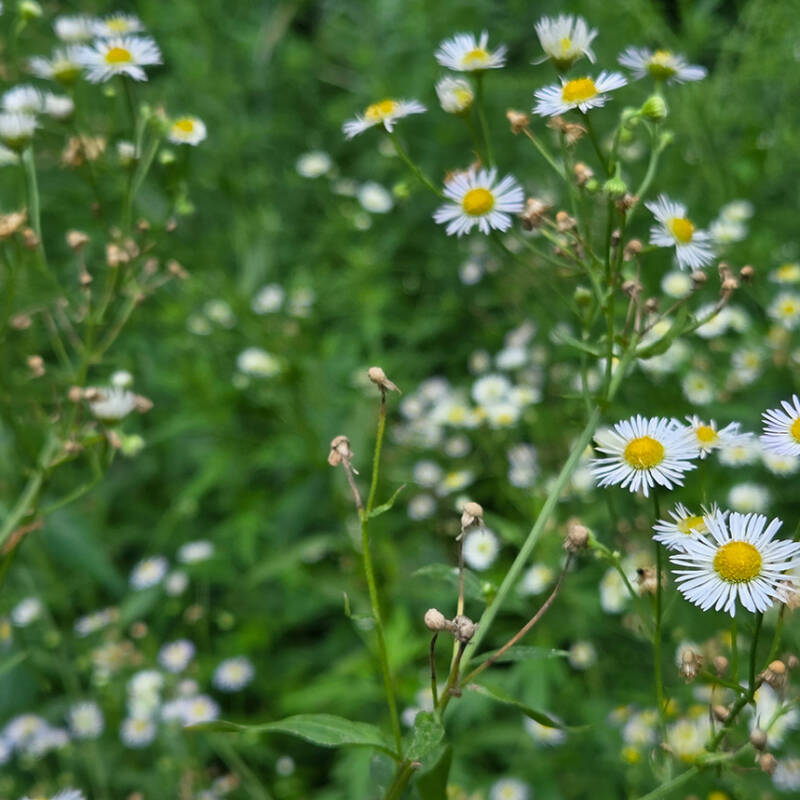
You may be able to grow “new to you” flowers, fruits, vegetables, and other plants. Maybe. Especially if you’re on a border of two zones.
The map is especially useful in helping you decide the right tree tree to plant. Due to the long lifespan of most trees, knowing the trend for your specific location can help you pick a tree that may thrive over one that may not. If your zone is shifting warmer and you love maple trees, the map can help you choose which one. Sugar maples do best in zones 4 through 8. Red maples do best in zones 3 through 9. If you’re in zone 7b in 2023, and you plant a sugar maple, a tree that can live over 300 years, it could find itself out of its comfort zone before it hits 100 years old. If you choose a red maple which can live on average between 80 and 100 years, but as long as 300 years, it could be happy until the end of its days.
Check out our Lookbook for more images of Cape Cod gardens.
See also:
- Global Warming: 10 Gardening Ideas to Counter Climate Change
- Ask the Expert: 5 Tips for a Sustainable Garden from Landscape Architect Marian Boswall
- 10 Favorites: Stalwart Plants that Thrive in Hot Gardens


Have a Question or Comment About This Post?
Join the conversation